
Learn graph basics: nodes, edges, neighbors, adjacency. Undirected vs directed, unweighted vs weighted. Representations including edge list, adjacency list, and matrix. Great intro for computer science students.
00:00 Graph Basics Introduction
00:41 Nodes and Edges
01:20 Node and Edge Classes in C++
03:46 Simple Graph Examples
04:29 Adding Edges – Undirected Unweighted
05:26 Real World Uses of Graphs
07:08 Graph Terminology – Neighbors and Adjacency
08:32 Edges Incident on Nodes
09:20 Graph Representations – Edge List
09:59 Adjacency List
10:27 Adjacency Matrix
11:19 Directed Graphs
13:04 Weighted Graphs and Path Costs
15:24 Video Conclusion
=-=-=-=-=-=-=-=-=
Thanks for watching!
Find us on other social media here:
- https://www.NeuralLantern.com/social
- Twitter / X: https://x.com/NeuralLantern
- Rumble: https://rumble.com/c/c-3696939
- BitChute: https://www.bitchute.com/channel/pg1Pvv5dN4Gt
- Daily Motion: https://www.dailymotion.com/neurallantern
- Minds: https://www.minds.com/neurallantern/
- Odysee: https://odysee.com/@NeuralLantern:5
Please show your support!
- Buy me a coffee: https://ko-fi.com/neurallantern
- Subscribe + Sharing on Social Media
- Leave a comment or suggestion
- Subscribe to the Blog: https://www.NeuralLantern.com
- Watch the main “pinned” video of this channel for offers and extras
Hello there. Let’s talk about graphs in the context of data structures and computer science.
I just want to talk to you about some of the basics of graphs, some ways that we could
implement them in the future, and some terminology. Okay, so for starters, we have a little
For starters, we have a little blank graph sheet here.
If you saw my previous video, you’ll know already that this is a valid graph.
It’s just totally empty.
There’s nothing on it.
But let me draw some data in this graph.
So graphs are collections of nodes and edges, or vertices and edges, or vertex and edges.
The nodes themselves, they are custom classes sometimes, other times not.
But you can imagine that they hold some sort of custom data.
of custom data so i know i did this in my last video but i just want to emphasize that this graph
class if we’re talking about c plus plus it should be a template class meaning we can specify a
custom data type that the nodes will hold and also a custom data type that the edges will have as
their weight you know typically when you see examples of this in the wild it’s just going to
floats and strings exotic custom classes depending on your use case it may or may not be useful to do
that but so we’ll have a data type for our nodes and i’ll call it like n type for like our node
type and then we’ll do another one called e type for edge type i don’t know if that’s the best way
to write those but i’m just going to do it anyway imagine that your glass your graph like we said
So I’m going to put a node class here.
You can imagine this as a vertex class.
And I’m going to say that this node holds an n type data.
And we’ll just call it data or node value or whatever you want.
And then the same thing for the edges.
We’ll say we have an edge class.
I think in my last video, instead of doing a node class, I did a vertex class.
It’s kind of all the same.
We’ll say we have an e type and we’ll call it weight or value or data if you want.
or value or data if you want but I think weight is a little bit closer to what we’re going to
actually be doing with it and what do I mean by n type and e type like what are those data types
there that just means these are placeholder tokens so when the user actually uses your graph by
making an instance of your graph class like they create an actual graph off of your blueprint
class here they might decide that they want integers inside of their nodes so that’s what
They might decide that they want floats inside of your nodes, inside of their nodes, or some
other data type.
And so that means like at runtime or at, I think actually at compile time for C++, this
end type would actually change to int if they chose to use integers on the inside.
Same thing would happen for the edge, whatever they choose for the E-type token is just going
to end up being used at compile time to replace that E-type.
So I don’t know.
Here’s an example.
example, I got a fly in my room, it’s bothering me. Imagine the user says I want a graph.
And I’ll call it G. And so they just have to kind of specify the two data types, maybe they want the
graph to have integer values in the nodes. And maybe, you know, floating point double precision
floating point values on the edges. In terms of weights, you know, you could do something like
And we have edges and this graph right here is valid.
It’s just one node kind of floating around by itself.
This graph is also still valid, even though we have two nodes that are floating unconnected
and also with the same value.
I’m just going to change the value to be different.
Maybe I’ll get rid of this extra thing here.
So this is a valid graph still.
We could have like a whole bunch of nodes all over the place and they don’t really have
to be connected.
This is still a valid graph.
change this to like a three, maybe change this to like an 11, change that to a six.
What else can I change?
How about like a 13?
How about like a 17?
Are there any duplicates?
I don’t think I see any.
All right.
So this is a valid graph.
The next thing that we could add to our graph is edges.
So edges are, you know, little mini data structures that connect nodes.
In this particular graph, I’m choosing to not have direction on my edges, which means this is a special type of graph.
Or four that we talked about in the previous video.
This is unweighted and also undirected, meaning there’s no weight assigned to the edges,
which means that template weight value or the weight data type that we just talked about before.
It’s kind of useless for this particular graph because I’m saying it’s unweighted.
well uh all the edges if we wanted to travel through the graph along the edges we could just
sort of go in any direction we felt like so this is unweighted and undirected
um let’s see what else can i show you real fast okay so let’s talk about um well really fast let’s
talk about the uses that you can have for a graph i think i talked about this in the last video
but um you know what can we use graphs for some people think they’re databases they’re not really
They’re not really databases.
You could technically do that, but it would be pretty slow.
There are much better data structures for databases.
Really what graphs are mostly used for is to represent relationships between different
things.
I think I said this in the last video.
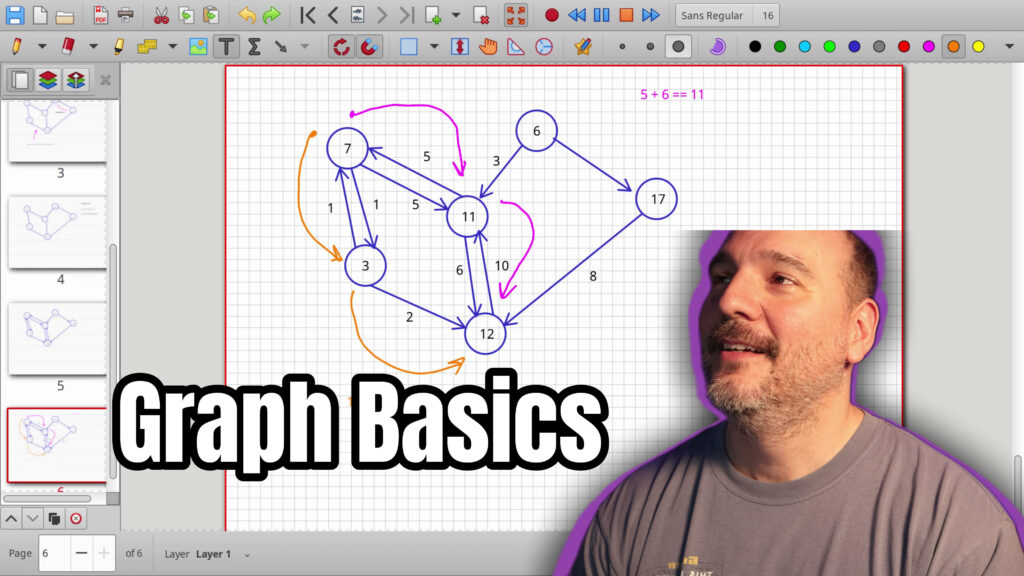
Imagine if every single node that you see here is a city and the edges represent flight
paths.
So we could fly between city seven and 11.
Oh, that’s funny.
I’m hungry for candy bar now.
between city seven and 11 and back and you know back in the other direction if we want to but we
can’t actually fly from city seven to six because there’s no edge there so we could represent
computer networks we could represent road maps airports dependency graphs game maps you could
say like every node is somewhere your character could stand and an edge represents where your
or represents a connection to another node so that you know your character could move there
there’s all sorts of different things that you could represent with the graph but
it’s not necessarily a fast database it’s more of like a relationship
not to be confused with relational database which is supposed to be lightning fast
like if i wanted to search for the number 17 in this graph it’s not going to be log time like a
proper database should be it’s not going to be constant time like a hash table based database
or like a no sql or whatever um so we have undirected and unweighted uh we talked about
like different uses let’s talk a little bit about terminology okay for starters notice how there’s
no hierarchy in this graph in other videos we’re going to talk about binary search trees and we
have to have like a hierarchy there’s no parent there’s no child in these graphs there’s no uh
you know like grandchildren ancestors descendants because there’s not really like a hierarchy it’s
It’s just things are connected to each other or they’re not.
But we can have something called neighbors.
For example, if you can reach a node in one hop, then you might be able to call that a neighbor.
So 6 and 17, those are neighbors.
Maybe I’ll just type neighbors right here.
Oops, neighbors.
Because we can reach them in one hop.
Later on, or especially if I don’t remember to mention this,
to our graph, then something is only considered a neighbor if you can reach it while respecting
the direction of the graph. So we have like neighbors as 6 and 17. So that means 6 and 11
are also neighbors. 6 and 12, not neighbors because they can’t reach each other in one hop.
Let’s see. Adjacency is basically the same thing. I can’t remember. I think we use adjacency more
often in directed graphs, but we could say that 6 and 17 are adjacent to each other,
adjacent to each other, which is in this context, sort of a synonym for neighbors.
Okay. Something else that I want to talk about in terms of edges,
edges are considered to be incident upon nodes or vertices. So like, you know,
if I have an arrow that just kind of points to these two things, I could say,
you know, edge is incident upon three and 12. It’s just, it just means,
and 12th. Okay, what else should we talk about? We should talk about connected versus, no,
that’s another video. Okay, I’m going to do another video for connected versus not connected graphs.
Maybe I should mention that there are three ways that we can represent a graph, and then maybe I’ll
upgrade to a directed graph in a second. If you want to know about the four different types of
graphs, see my previous video. But for now, I’m going to say there are three ways we could
to represent these graphs. The first way, and I’m talking about how can you represent these
graphs inside of the machine? Like how can your computer store and process this graph and maybe
run algorithms on it? So the first way that we could represent, at least that I’m going to talk
about, is an edge list. Edge lists are super simple. I’m going to do a dedicated video just
for edge lists in the future. They’re not very fast, but they’re very easy to implement. So
So honestly, if you’re just starting with this stuff, I would recommend just implementing an edge list first
The next thing that you can do to represent a graph in the machine is make an adjacency list
Adjacency lists are just a little bit more complicated
But they’re typically faster than edge lists. Not always not in all cases and
In terms of time complexity, you might not feel like you notice much of a difference
but empirically
the option of skipping a lot of examinations when you don’t need to examine something,
you kind of skip it.
We’ll talk more about that in the future.
But we have an edge list and adjacency list of representation.
And then we have an adjacency matrix.
I wish I had spell check on this.
Otherwise, this is going to be humiliating.
An adjacency matrix is sometimes a lightning fast representation of a graph.
At first, you might think, wow, that’s amazing.
I’m always going to use that.
always going to use that. But all of these representations have strengths and weaknesses.
None of them are better than the others in every single circumstance. So, you know, computer science
and data structures, it’s all about weighing the pros and cons and picking the right representation
or algorithm or whatever that’s best for you and the code and the data that you’re actually going
to run. So three different ways that we can represent a graph in the future. And let’s see,
already on this. We talked about the basic ways to use them sort of. We talked about neighbors
and adjacency. Oh, I got to upgrade to a directed graph real fast just to kind of show you the
difference here. Okay, so I’m going to duplicate this and I’m just going to start adding direction
to all my edges. In my previous video, we talked about this. If you add direction to even one edge,
then you have to add direction to all the other edges. Otherwise, you will have an invalid graph.
graph so notice how I add a direction to one edge I now have an invalid graph so
I’m just gonna do this change every single edge so that every single edge
has a direction you know the basic thing we kind of talked about this in my
previous video is that when traveling through the graph you’re supposed to
only be able to travel in the direction of an edge which means if you look at
this thing right now you’re supposed to be able to go from 11 to 7 but you’re
be able to go from 7 to 11 because that violates the direction of the edge. When we add direction
we’re sort of like reducing you know the flexibility of the graph so you can imagine
that the previous version that was undirected it was sort of like every single edge here
was really two edges pointing in opposite directions if that makes sense. So if you
wanted to make sure that you could go back and forth between edge sorry between node 7 and 11
the opposite direction you can also do things called parallel edges which is just to say
i’m going to add multiple edges that that go in the same direction from the same start node to
the same end node but i’m not going to do that here that makes it more complicated for some
representations but we can just sort of add a whole bunch of edges i’m just going to say one
going back and forth there and so forth remember in my previous video we talked about weighted edges
about weighted edges which means we could add a cost to traveling along an edge so you could say
something like uh i don’t know going from 7 to 12 let’s add another edge here if there was a cost
on all these weights maybe i should just add that for fun we could maybe calculate which path would
be better so let’s say we got ones over here and we got fives over here um and maybe like a like
and I’m going to do like an eight.
By the way, these sixes don’t have to be the same.
You could just be two different numbers.
So I’m going to do like a three here.
And let me just see, have I added a weight to every single edge?
So I know I did this in the previous video,
but I want to do it again real fast.
If we chose to take a path from seven to 12,
and we said seven to 11, and then 11 to 12,
that’s a very specific path, which is,
it’s going to cost us five to go along that first,
as you have to go along that first edge and then the second edge is going to cost us six
and we’re only traveling along two edges so the total cost of that path is 11.
On the other hand let me actually make this look pink.
On the other hand if we’re taking a different path we might come up with a different cost
depending on the graph. So let’s say we start at 11 start at 7 maybe we want to go down to 3
to three and then from three we’ll go to 12 well that might be a different cost so i’m going to say
the cost of this particular path is traveling it’s going to cost us one to go down that first edge
and then a two to go down that second edge which means the total cost of getting to 12 is only 3
if we take that orange path versus 11 if we take that pink path i hope you’re starting to visualize
how graphs might be useful to visualize costs if this is a network map we just figured out that
network map we just figured out that one route through the network might be faster or less
costly than the other or if this is like an airport map maybe you do want to take you know
that layover that goes down south instead of that layover that goes east in terms of
i don’t know frequent fire miles that it costs you or money it costs you or jet fuel that it
That’s all I wanted to talk about in this video.
I’m going to make one more video today.
Well, it’ll be released.
I don’t know when, but like in my present moment.
I’m going to make another video right after this
where we just talk about connected graphs versus not connected graphs.
Thank you so much for watching this video.
I hope you learned a little bit of stuff and had a little bit of fun.
See you in the future.
Okay.
In the future.
in the future.
So we’ll be able to do more videos, longer videos, better videos, or just I’ll be able to keep making videos in general.
So please do me a kindness and subscribe.
You know, sometimes I’m sleeping in the middle of the night and I just wake up because I know somebody subscribed or followed.
It just wakes me up and I get filled with joy.
That’s exactly what happens every single time.
So you could do it as a nice favor to me or you could troll me if you want to just wake me up in the middle of the night.
Just subscribe and then I’ll just wake up.
I promise that’s what will happen.
happen also if you look at the middle of the screen right now you should see a QR code which
you can scan in order to go to the website which I think is also named somewhere at the bottom of
this video and it’ll take you to my main website where you can just kind of like see all the videos
I published and the services and tutorials and things that I offer and all that good stuff and
if you have a suggestion for clarifications or errata or just future videos that you want to
videos that you want to see please leave a comment or if you just want to say hey what’s up what’s
going on you know just send me a comment whatever i also wake up for those in the middle of the
night i get i wake up in a cold sweat and i’m like it would really it really mean the world to me i
would really appreciate it so again thank you so much for watching this video and um enjoy the cool
so
Thank you.